Monitoring focus
The coral monitoring component of the Marine Monitoring Program (MMP) assesses inshore coral reefs and reports annually on current health and long-term trends in condition.
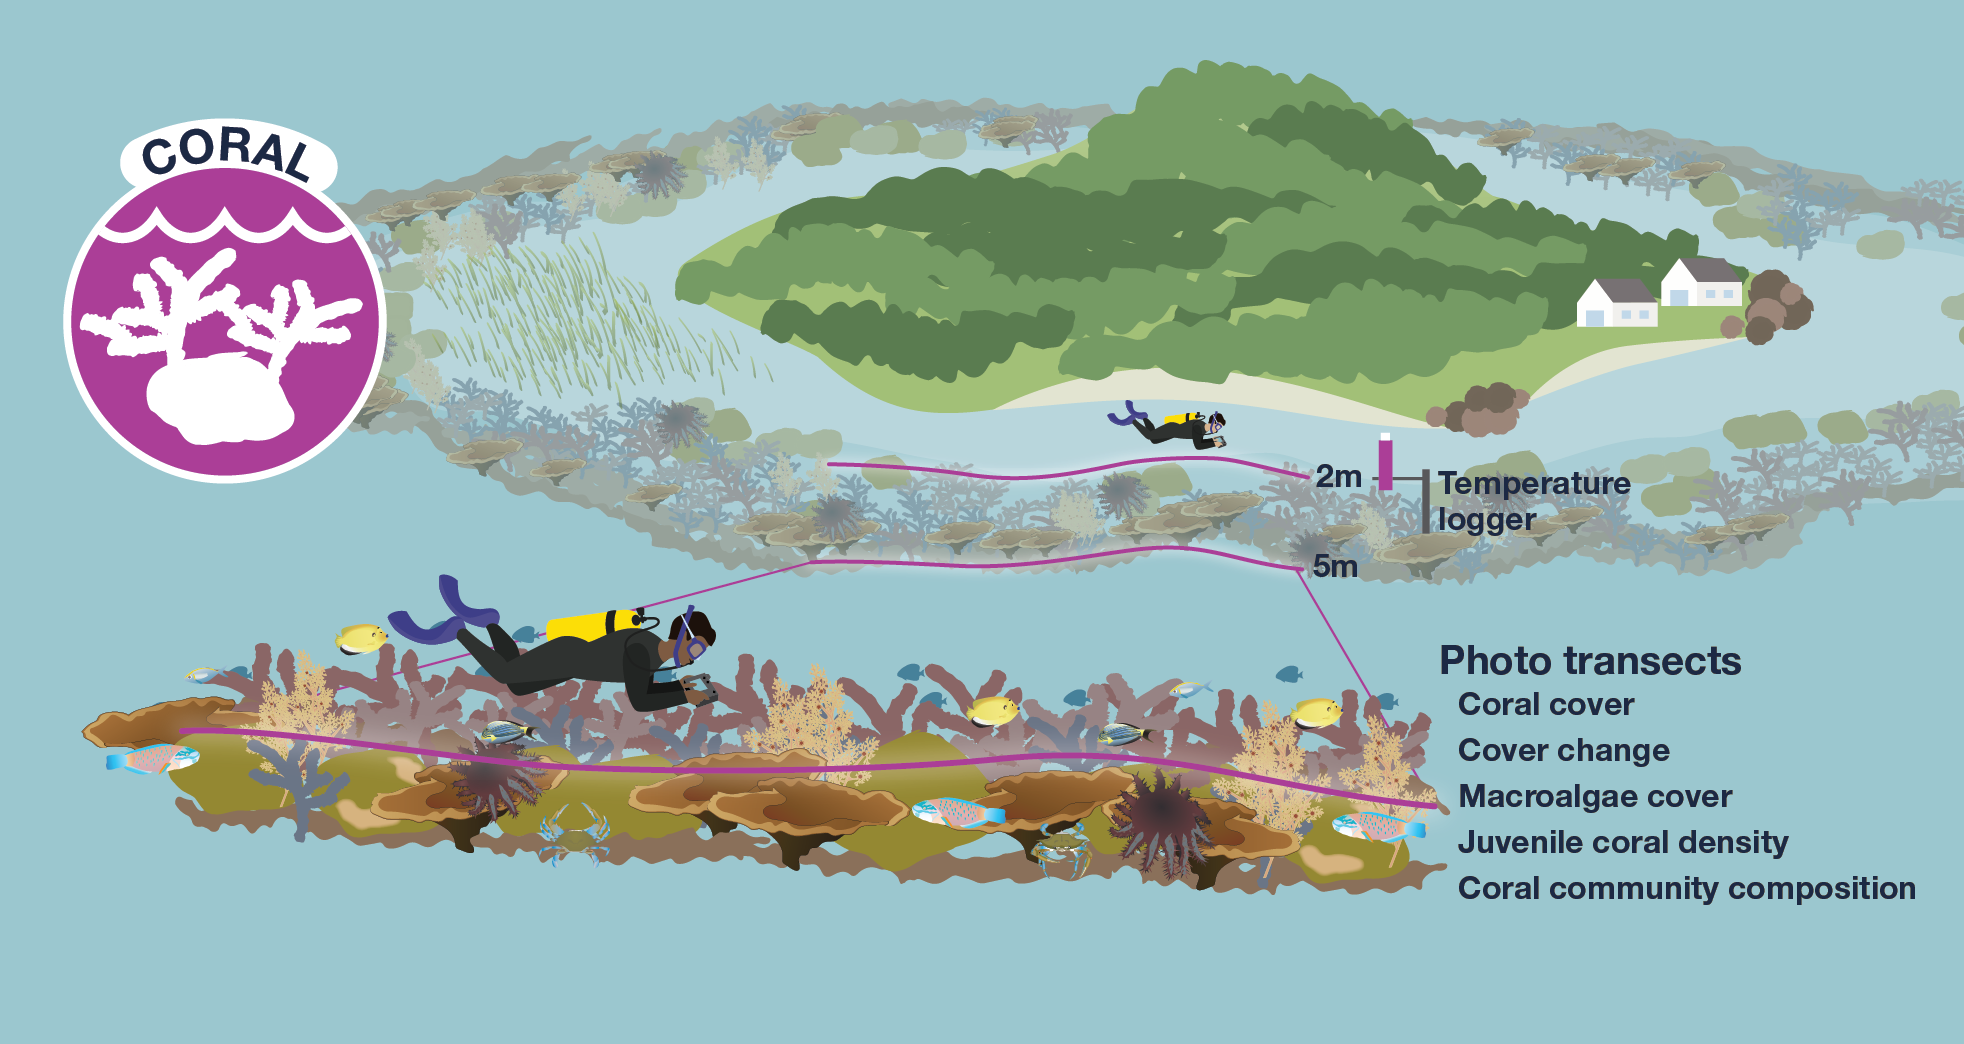
At each site, coral monitoring is conducted by assessing the following indicators:
- coral cover
- proportion of macroalgae
- juvenile coral density
- rate at which coral cover changed
- coral community composition (genus level)
Additionally, signs of bleaching, disease, physical scars from Drupella sp. and crown-of-thorns starfish predation, and any other visible damage are recorded.
Key environmental pressures in 2024-25
- Key observations
- No cyclones crossed the Reef during the 2024–25 monitoring season.
- There was above-average rainfall and river discharge across all Reef catchments in 2024–25. The Burdekin region experienced its highest river discharge since the 2010–11 floods (6.8 times the long-term median).
- Sea surface temperatures over the 2025 summer were above long-term averages and within the 6-8 degree heating weeks (DHW) for which coral bleaching was probable in the northern Wet Tropics and close to the coast in the Burdekin region. However, no major loss of coral was attributed to these temperatures.
- Coral-eating crown-of-thorns starfish were present on reefs in the Johnstone Russell–Mulgrave sub-region at ‘outbreak’ densities at Fitzroy Island, High Island and in the Frankland Group. The impact of these starfish on corals was reduced by culling undertaken by the Crown-of-thorns Starfish Control Program.
Inshore coral condition findings
Reef-wide, inshore reefs have remained in an overall ‘poor’ condition since 2018. However, there are regional differences, with northern and southern regions experiencing varying changes in conditions.
Findings by region
Cape York
For safety reasons, the MMP does not monitor inshore coral reefs in the Cape York region.
Wet Tropics
In the Wet Tropics, the Coral Index has remained ‘moderate’ since 2005, although it was stable at the top of the ‘moderate’ range from 2016 to 2022. While still in the same ‘moderate’ range in 2025, conditions have declined in both the Barron-Daintree and Herbert-Tully sub-regions.
Barron-Daintree subregion
The Coral Index remains ‘poor’ and has declined to the lowest level recorded. Results in 2024 revealed reefs had been severely impacted by freshwater inundation and waves associated with the passage of Tropical Cyclone Jasper. Results for 2025 show a further decline as the recolonisation of parts of the reef by macroalgae has reduced the Macroalgae indicator score.
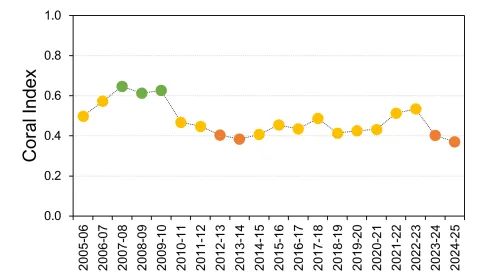
Figure above: Temporal trend in regional Coral Indices from 2005–06 to 2024–25. Values are scaled from 0.00–1.00 and graded: very good (0.81–1.00), good (0.61–0.80), moderate (0.41–0.60), poor (0.21–0.40), very poor (0.0–0.20). Note scores are unitless. Data source: Thompson et al. (2026).
Johnstone Russell-Mulgrave subregion
The Coral Index remained ‘moderate’ and stable since declining between 2021 and 2024. The recent declines were due to the cumulative impacts of coral bleaching, Tropical Cyclone Jasper and crown-of-thorns starfish that variously reduced coral cover across the region. Despite the ongoing removal of crown-of-thorns starfish by the Crown-of-thorns Starfish Control Program, outbreak densities were again observed on the eastern aspects of each island, or island group.
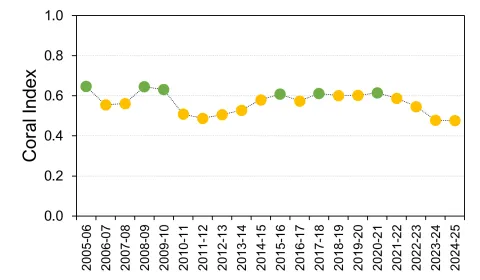
Figure above: Temporal trend in regional Coral Indices from 2005–06 to 2024–25. Values are scaled from 0.00–1.00 and graded: very good (0.81–1.00), good (0.61–0.80), moderate (0.41–0.60), poor (0.21–0.40), very poor (0.0–0.20). Note scores are unitless. Data source: Thompson et al. (2026).
Herbert-Tully subregion
The Coral Index has continued to decline but remains ‘moderate’. The decline in 2025 largely captures the exposure of shallow sites at Dunk Island and Bedarra Island to low salinity floodwaters. The floods killed corals and resulted in reduced scores for the Coral cover, Juvenile coral and Composition scores but improved scores for the Macroalgae indicator as macroalgae were also impacted by the flood. In other areas such improvements in Macroalgae scores following a disturbance event have proven short-lived and it is likely scores for this indicator will decline next year as the macroalgae community is reestablished.
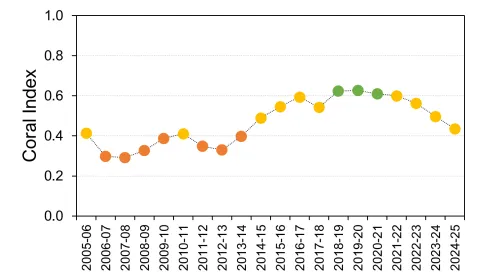
Figure above: Temporal trend in regional Coral Indices from 2005–06 to 2024–25. Values are scaled from 0.00–1.00 and graded: very good (0.81–1.00), good (0.61–0.80), moderate (0.41–0.60), poor (0.21–0.40), very poor (0.0–0.20). Note scores are unitless. Data source: Thompson et al. (2026).
Burdekin
The Coral Index for the Burdekin region was ‘moderate’, remaining in the same range since 2016 but continuing to decline since 2019.
In early 2025 reefs were exposed to both low salinity floodwaters and wave damage associated with a localised storm stemming from a particularly active monsoon. These events caused reductions in the Coral cover score at both 2 m and 5 m depths. The influence of these impacts was moderated by improved scores for the Macroalgae indicator as levels of macroalgae were also reduced by the summer’s events. This marked improvement in the Macroalgae indicator score is likely to be temporary, as macroalgae typically recolonise swiftly following a disturbance event.
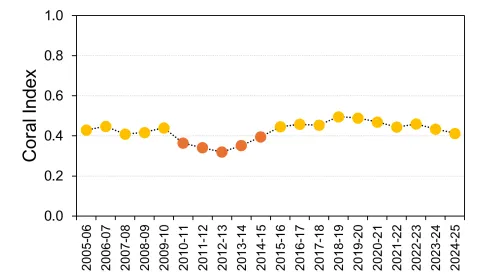
Figure above: Temporal trend in regional Coral Indices from 2005–06 to 2024–25. Values are scaled from 0.00–1.00 and graded: very good (0.81–1.00), good (0.61–0.80), moderate (0.41–0.60), poor (0.21–0.40), very poor (0.0–0.20). Note scores are unitless. Data source: Thompson et al. (2026).
Mackay-Whitsunday
The Coral Index in Mackay-Whitsunday region improved to ‘moderate’, as the recovery of coral communities from the severe impacts of Tropical Cyclone Debbie accelerates. Driving this recovery has been the continued increase in the density of juvenile corals. While still ‘poor’, the Coral cover indicator has consistently improved as juvenile and surviving corals grow.
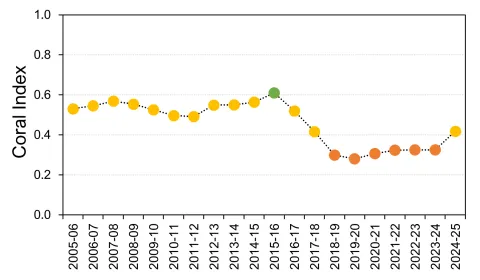
Figure above: Temporal trend in regional Coral Indices from 2005–06 to 2024–25. Values are scaled from 0.00–1.00 and graded: very good (0.81–1.00), good (0.61–0.80), moderate (0.41–0.60), poor (0.21–0.40), very poor (0.0–0.20). Note scores are unitless. Data source: Thompson et al. (2026).
Fitzroy
In the Fitzroy region, the Coral Index declined to ‘very poor’ in 2025, driven by reductions in the Coral cover indicator. The marine heatwave of 2024 had a severe impact on coral communities in this region. During surveys in 2024 many corals were still bleached and initial declines in coral cover were evident. However, the full impact of the heat stress only became clear in 2025, when surveys revealed a 57% loss of hard coral cover compared to 2023 levels.
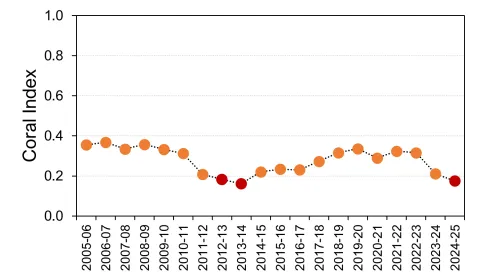
Figure above: Temporal trend in regional Coral Indices from 2005–06 to 2024–25. Values are scaled from 0.00–1.00 and graded: very good (0.81–1.00), good (0.61–0.80), moderate (0.41–0.60), poor (0.21–0.40), very poor (0.0–0.20). Note scores are unitless. Data source: Thompson et al. (2026).
Burnett-Mary
There are few coral reefs in inshore waters of the Burnett-Mary region, and no established MMP monitoring sites in this region.
Read the 2024-25 Synthesis Report for a more in-depth summary of results of the latest monitoring year findings and long-term trends with reference to 20 years of data. The 2024-25 Summary Booklet provides an overview of findings at Reef-wide and regional levels. Results can also be viewed on our interactive dashboard via the Reef Knowledge System.
The 2024-25 MMP technical reports for each monitoring component are available on the Reef Authority’s elibrary.
Coral monitoring data can be found on AIMS’ Reef dashboard.
Further information on QA/QC processes for research activities associated with the annual technical reports can be found in the Marine Monitoring Program Annual Report Quality Assurance and Quality Control Manual 2024–25.
Learn more about: