Monitoring focus
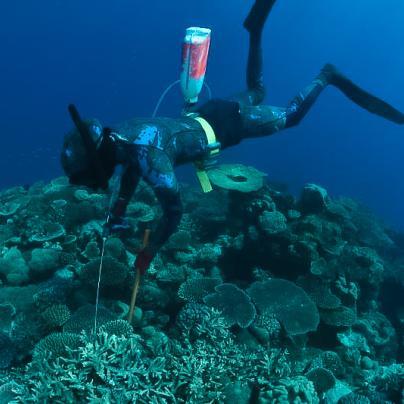
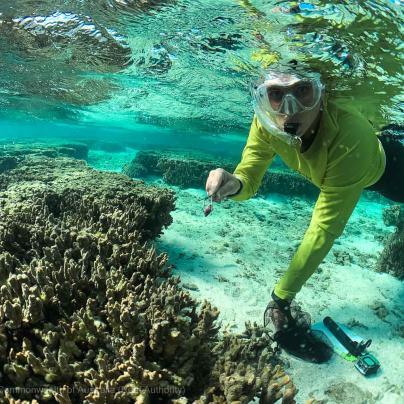
The water quality monitoring component of the Marine Monitoring Program (MMP) reports on current and long-term condition of inshore Reef water quality through routine sampling and flood response sampling following extreme events.
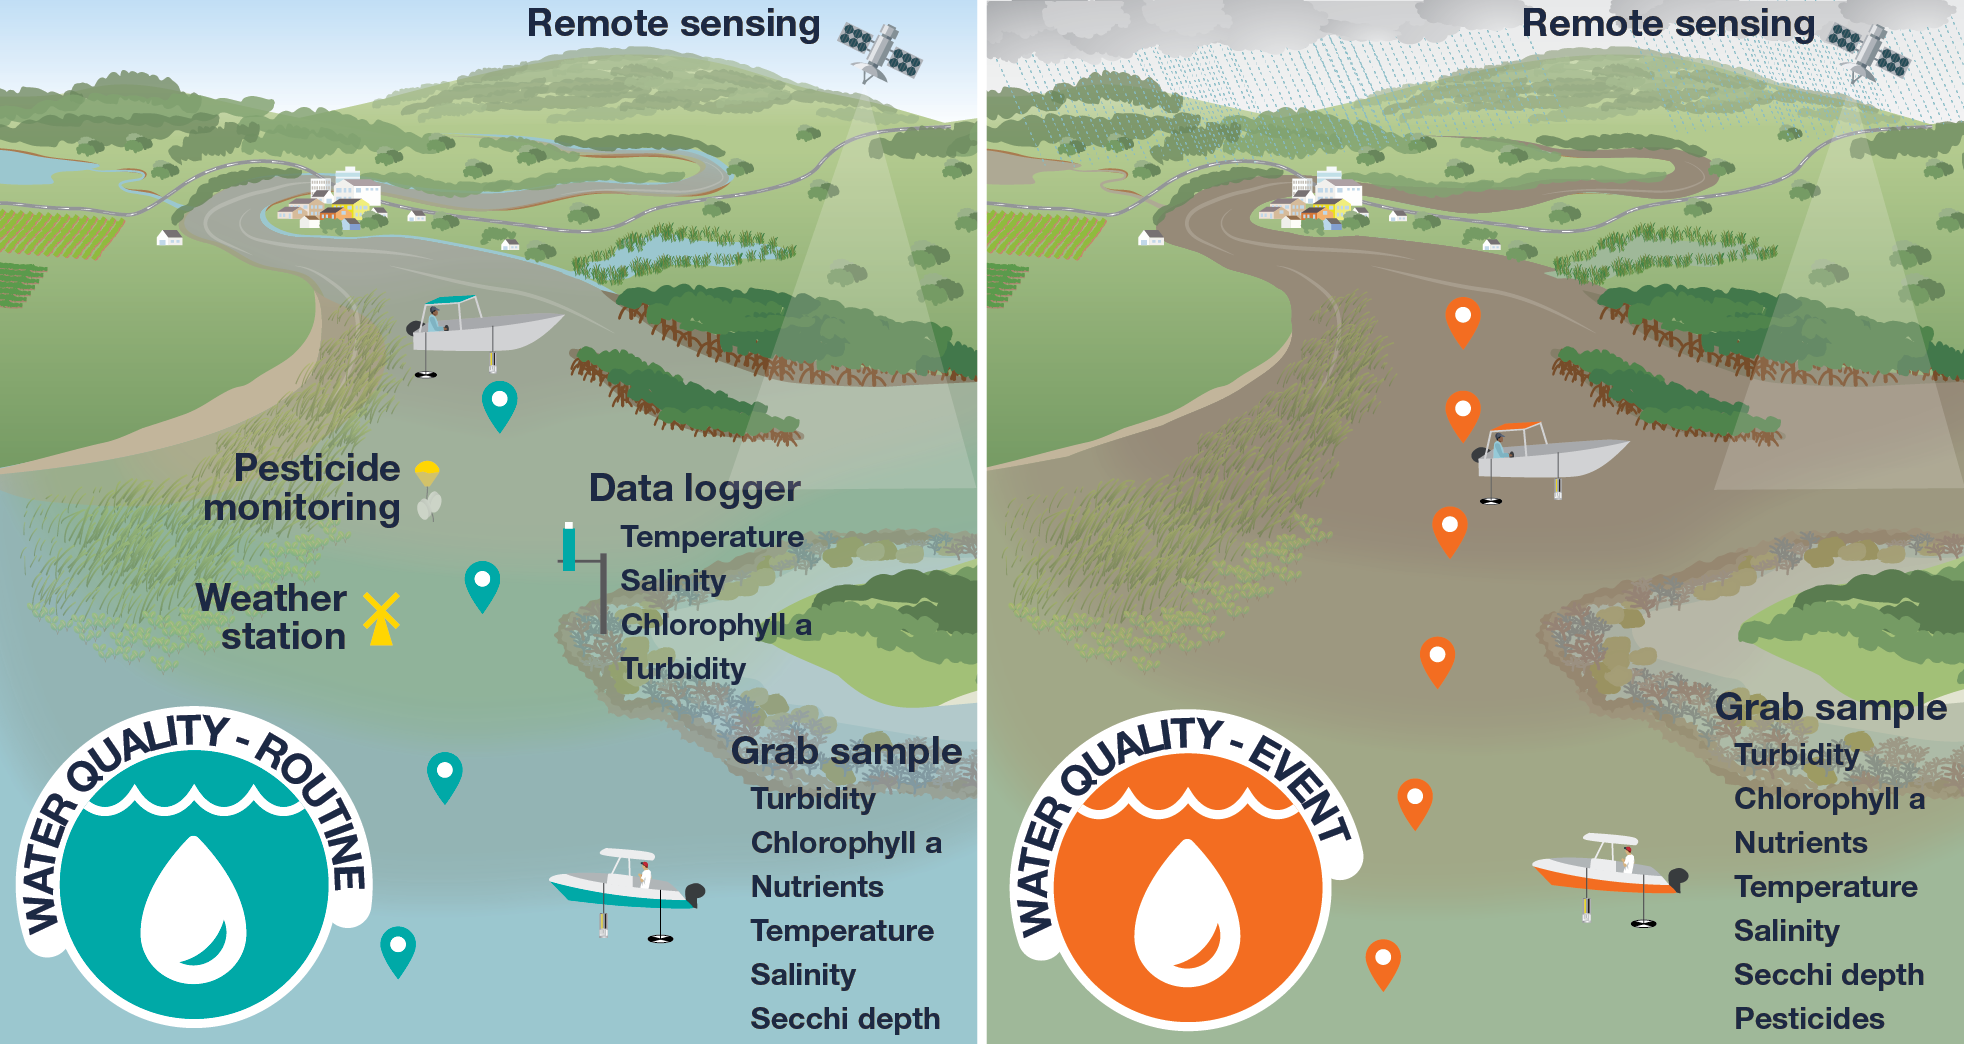
Water quality monitoring is routinely undertaken during wet and dry seasons (left), along permanent transects located from river mouths to open coastal areas. Additional monitoring of flood plumes is conducted opportunistically during flood events (right).
Key environmental pressures in 2024-25
- Key observations
- No cyclones crossed the Reef during the 2024–25 monitoring season.
- There was above-average rainfall and river discharge across all Reef catchments in 2024–25. The Burdekin region experienced its highest river discharge since the 2010–11 floods (6.8 times the long-term median).
Inshore water quality findings
Inshore water quality was assessed as either ‘moderate’ or ‘good’ condition in 2024–25, depending on the region.
Water quality Guideline Values were:
- met in most regions for total suspended solids, particulate nitrogen, particulate phosphorus and chlorophyll a; and
- not met in any region for turbidity, Secchi depth, and nitrate/nitrite.
Exposure to risk
About 11,220 km² of the Reef was potentially exposed to pollutants, which was around 4% of coral reefs, 77% of seagrasses, and 50% of inshore waters. Almost 90% of the Reef, primarily the mid-shelf and offshore waters, was at no or very low risk of exposure to pollutants during the 2024–25 wet season.
Pesticides
Pesticides were detected at all monitored sites, and samples from 6 of 8 monitored sites exceeded species protection targets. Consistent with previous years, Sandringham Bay in the Mackay-Whitsunday region recorded the highest pesticide concentrations, driven by high levels of the insecticide imidacloprid.
Cape York
Water quality is improving following a deterioration in 2023–24 associated with Tropical Cyclone Jasper.
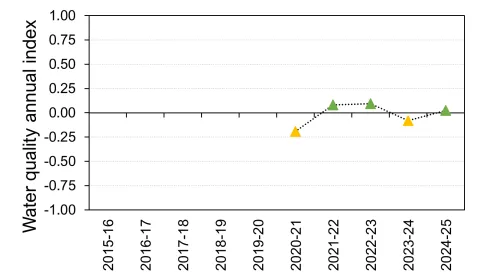
Figure above: Temporal trends in the Annual Water Quality Index for the Cape York region. Values are scaled from -1.0 to 1.0 and graded: very good (1 to 0.5), good (0.5 to 0),
moderate (< 0 to -1/3), poor (< -1/3 to -2/3), very poor (< -2/3 to -1). Note scores are unitless. Data source: Gruber et al. (2026).
Wet Tropics
The Annual Water Quality Index score for the Wet Tropics region was ‘moderate’ for the 2024–25 monitoring year but deteriorating, which is related to high river discharge over the past 2 years.
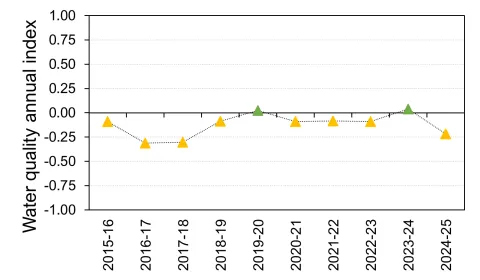
Figure above: Temporal trends in the Annual Water Quality Index for the Wet Tropics region. Values are scaled from -1.0 to 1.0 and graded: very good (1 to 0.5), good (0.5 to 0), moderate (< 0 to -1/3), poor (< -1/3 to -2/3), very poor (< -2/3 to -1). Note scores are unitless. Data source: Gruber et al. (2026).
Burdekin
The Annual Condition Water Quality Index for the Burdekin region scored ‘good’ for the 2024–25 monitoring year, which was similar to 2023–24.
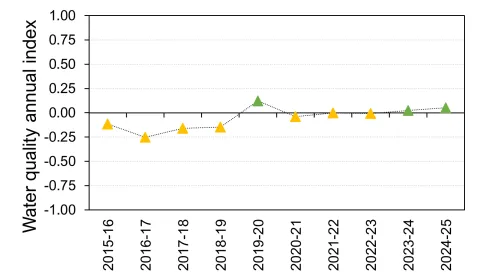
Figure above: Temporal trends in the Annual Water Quality Index for the Burdekin region. Values are scaled from -1.0 to 1.0 and graded: very good (1 to 0.5), good (0.5 to 0), moderate (< 0 to -1/3), poor (< -1/3 to -2/3), very poor (< -2/3 to -1). Note scores are unitless. Data source: Gruber et al. (2026).
Mackay-Whitsunday
The Annual Condition Water Quality Index for the Mackay-Whitsunday region still scored ‘moderate’ for the 2024–25 monitoring year, but lower in the ‘moderate’ range than previous years. This interrupts the gradual improvement in the region observed since Tropical Cyclone Debbie in March 2017.
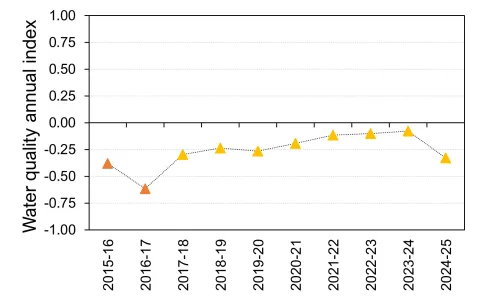
Figure above: Temporal trends in the Annual Water Quality Index for the Mackay-Whitsunday region. Values are scaled from -1.0 to 1.0 and graded: very good (1 to 0.5), good (0.5 to 0), moderate (< 0 to -1/3), poor (< -1/3 to -2/3), very poor (< -2/3 to -1). Note scores are unitless. Data source: Gruber et al. (2026).
Fitzroy
The Annual Condition Water Quality Index for the Fitzroy region scored ‘good’ for the 2024–25 monitoring year. The Fitzroy region has had a fairly stable Water Quality Index over the last 5 years.
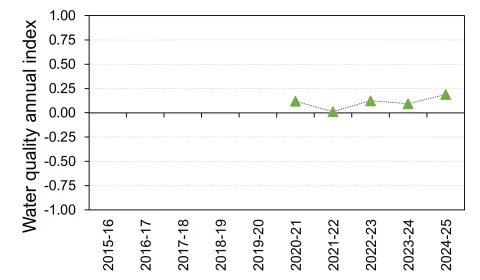
Figure above: Temporal trends in the Annual Water Quality Index for the Fitzroy region. Values are scaled from -1.0 to 1.0 and graded: very good (1 to 0.5), good (0.5 to 0), moderate (< 0 to -1/3), poor (< -1/3 to -2/3), very poor (< -2/3 to -1). Note scores are unitless. Data source: Gruber et al. (2026).
Burnett-Mary
There is no formal water quality monitoring program in the Burnett-Mary region that is reported as part of the Paddock to Reef program. As a result, Water Quality index values are not available for this region.
Read the 2024-25 Synthesis Report for a more in-depth summary of results of the latest monitoring year findings and long-term trends with reference to 20 years of data. The 2024-25 Summary Booklet provides an overview of findings at Reef-wide and regional levels. Results can also be viewed on our interactive dashboard via the Reef Knowledge System.
The 2024-25 MMP technical reports for each monitoring component are available on the Reef Authority’s elibrary.
In-situ water quality monitoring data can be downloaded from AIMS.
Further information on QA/QC processes for research activities associated with the annual technical reports can be found in the Marine Monitoring Program Annual Report Quality Assurance and Quality Control Manual 2024–25.
Learn more about: