Monitoring focus
The seagrass monitoring component of the Marine Monitoring Program (MMP) assesses inshore seagrass meadows and reports annually on current health and long-term trends in condition.
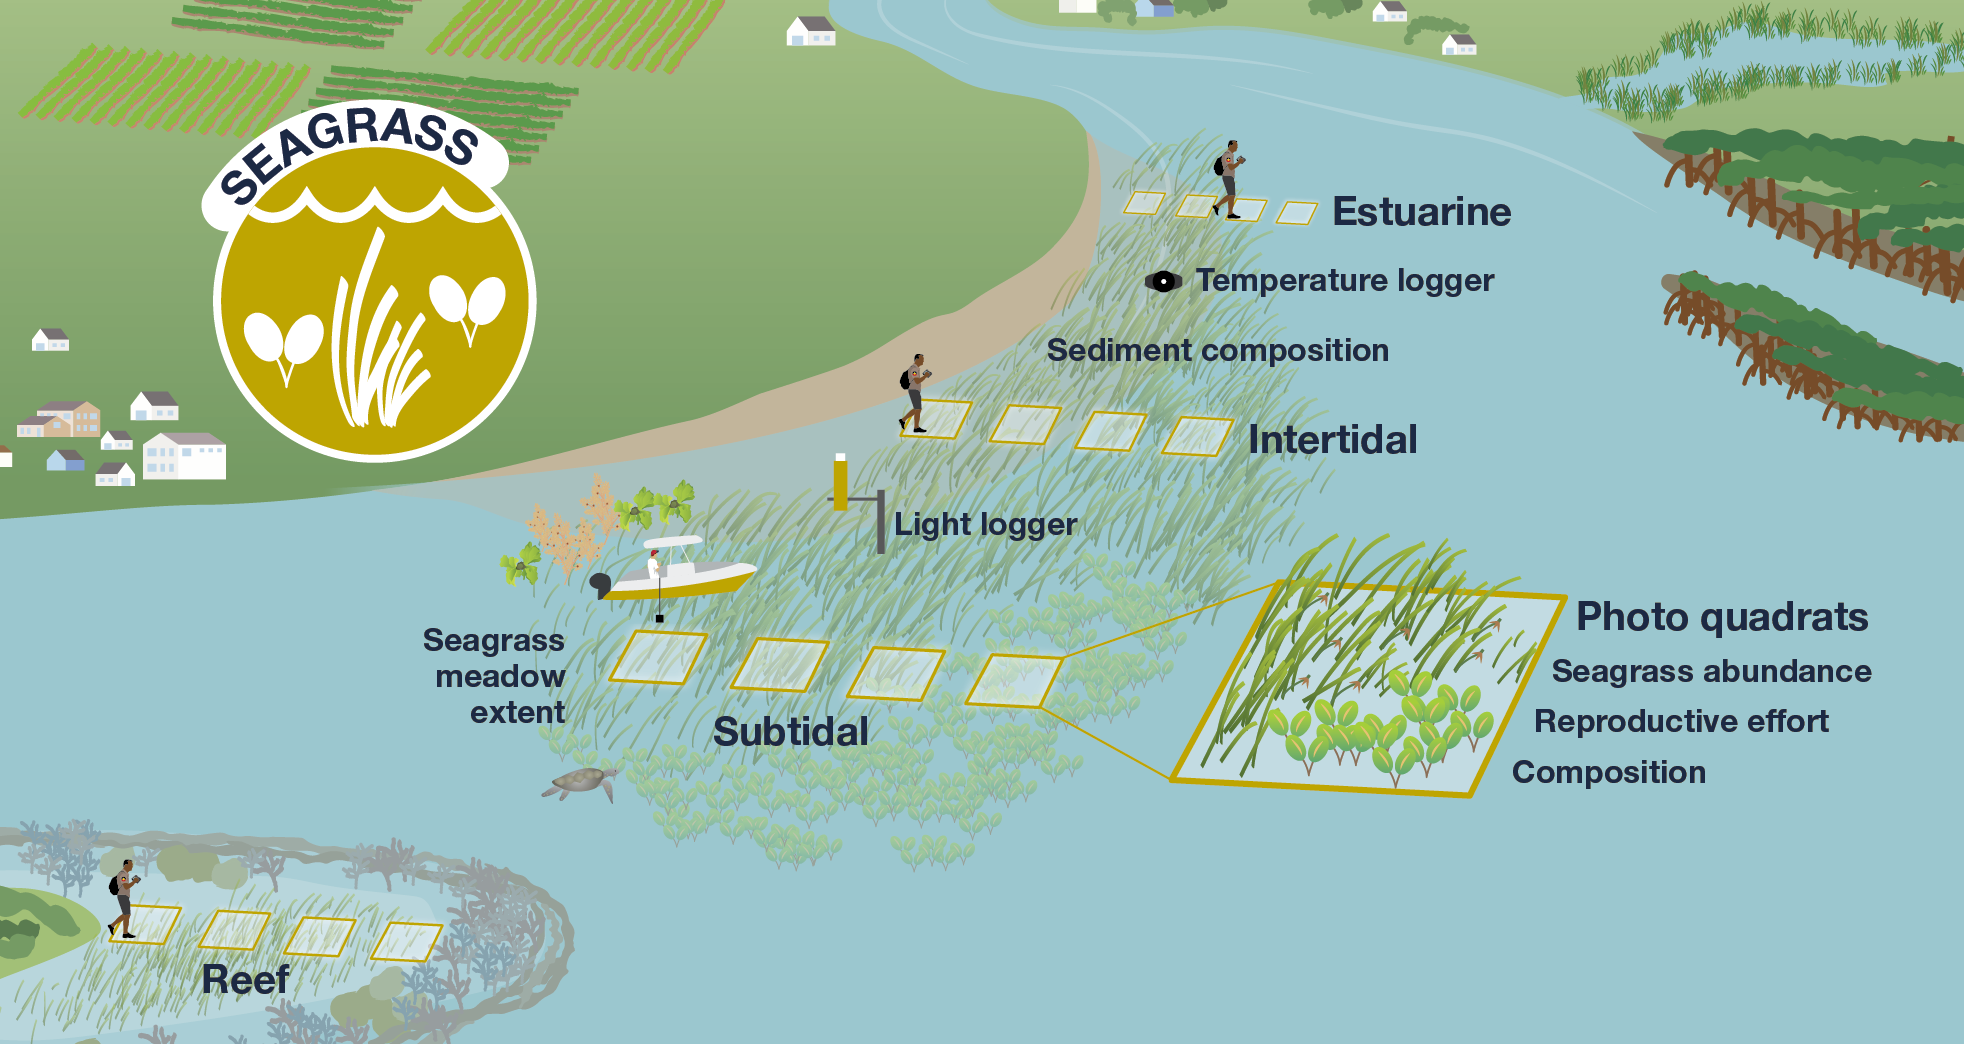
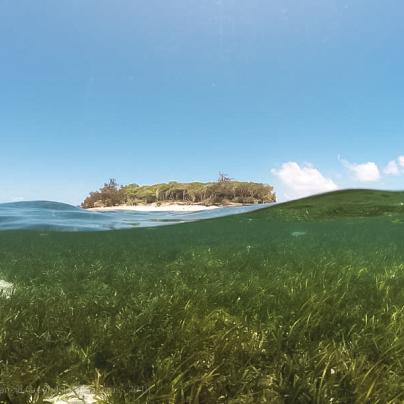
Inshore seagrass meadows are monitored at sites in five types of habitats: estuarine, coastal intertidal and subtidal, reef intertidal and reef subtidal.
Seagrass monitoring is conducted by assessing the ‘abundance’ and ‘resilience’ indicators at each site. Further details of these metrics can be found in the annual technical reports and the Resilience in practice report.
In addition to these indicators, seagrass species, the size and patchiness of the seagrass meadows, and the density of seeds in the seed bank are also assessed.
Factors that can affect seagrass conditions are also recorded. This includes within-canopy seawater temperature, the amount of light reaching the plants, sediment characteristics, and the abundance of macroalgae and epiphytes.
Key environmental pressures in 2024-25
- Key observations
- No cyclones crossed the Reef during the 2024–25 monitoring season.
- There was above-average rainfall and river discharge across all Reef catchments in 2024-25. The Burdekin region experienced its highest river discharge since the 2010–11 floods (6.8 times the long-term median).
- Widespread elevated discharge contributed to below-average light availability, which is a key limiting factor for seagrass productivity.
- Daily within-canopy seawater temperatures were the fourth consecutive year of above-average temperatures, and the sixth-highest recorded since the MMP began (2016–17 was the highest).
Inshore seagrass condition findings
Overall inshore seagrass condition (abundance and resilience) declined from ‘moderate’ to ‘poor’ in the 2024-25 monitoring year. This is the lowest seagrass condition score in over a decade. There were large improvements in seagrass condition in the Fitzroy and Burnett-Mary regions, but these were offset by declines in other regions.
Cape York
Seagrass condition was assessed only in the late dry in Cape York, which precedes the summer when the highest rainfall, river discharge and temperatures occurred. Seagrass meadow condition declined to ‘poor’ and is at the lowest level since monitoring commenced. Due to the timing of surveys in Cape York, this is the first seagrass monitoring data to capture the effects of Tropical Cyclone Jasper in December 2023.
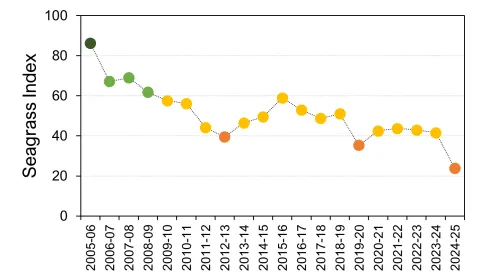
Figure above: Seagrass Condition Index scores for the Cape York region from 2005–06 to 2024–25. Black line with circles represents the index score and values are scaled from 0–100 and graded: very good (81–100), good (61–80), moderate (41–60), poor (21–40), very poor (0–20). Note, scores are unitless. Data source: McKenzie et al. (2026).
Wet Tropics
The Wet Tropics Seagrass Index experienced a marginal decline in 2024–25 and is still ‘poor’. Seagrass condition showed a minor drop in both the northern and southern Wet Tropics regions, maintaining a status of ‘moderate’ and ‘poor’, respectively.
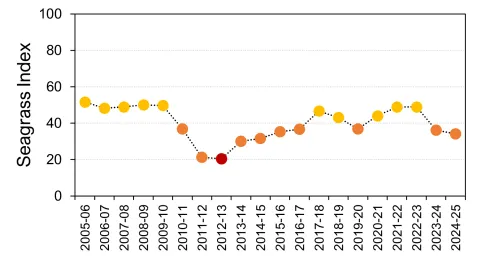
Figure above: Seagrass Condition Index scores for the Wet Tropics region from 2005–06 to 2024–25. Black line with circles represents the index score and values are scaled from 0–100 and graded: very good (81–100), good (61–80), moderate (41–60), poor (21–40), very poor (0–20). Note, scores are unitless. Data source: McKenzie et al. (2026).
Burdekin
The condition of seagrass meadows throughout the Burdekin region continued to decline in 2024–25, ultimately remaining in a ‘poor’ state.
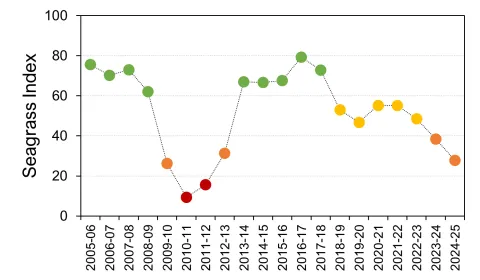
Figure above: Seagrass Condition Index scores for the Burdekin region from 2005–06 to 2024–25. Black line with circles represents the index score and values are scaled from 0–100 and graded: very good (81–100), good (61–80), moderate (41–60), poor (21–40), very poor (0–20). Note, scores are unitless. Data source: McKenzie et al. (2026).
Mackay-Whitsunday
Overall condition of inshore seagrass meadows across the Mackay–Whitsunday region marginally declined in 2024–25, but condition remained ‘moderate’.
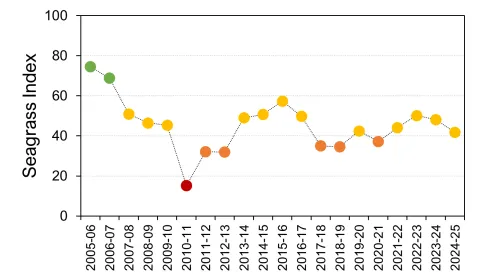
Figure above: Black line with circles represents the index score and values are scaled from 0–100 and graded: very good (81–100), good (61–80), moderate (41–60), poor (21–40), very poor (0–20). Note, scores are unitless. Data source: McKenzie et al. (2026).
Fitzroy
Overall, the seagrass condition for the Fitzroy region improved to ‘moderate’ in 2024–25. Seagrass abundance score significantly improved from the previous period, achieving its highest score since 2007–08. The increase can be attributed to improved conditions in estuarine and coastal habitats, while the status of reef habitats has remained unchanged.
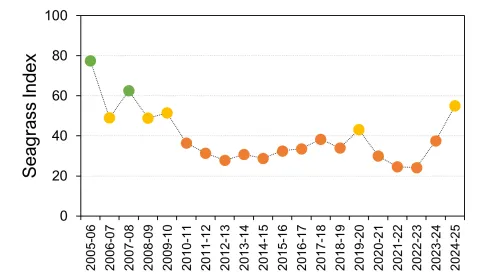
Figure above: Seagrass Condition Index scores for the Fitzroy region from 2005–06 to 2024–25. Black line with circles represents the index score and values are scaled from 0–100 and graded: very good (81–100), good (61–80), moderate (41–60), poor (21–40), very poor (0–20). Note, scores are unitless. Data source: McKenzie et al. (2026).
Burnett-Mary
Inshore seagrass meadows across the Burnett–Mary region improved in overall condition in 2024–25, with the Seagrass Index increasing to ‘good’. Seagrass abundance increased to its highest level since the MMP commenced. This improvement was observed throughout the region, covering all locations, with abundances surpassing long-term averages for both estuarine and coastal habitats.
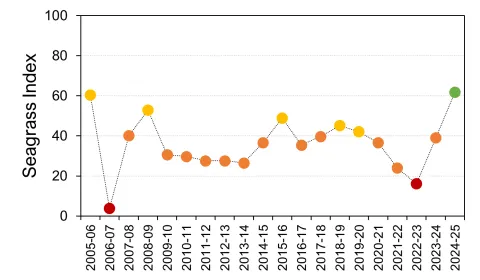
Figure above: Seagrass Condition Index scores for the Burnett-Mary region from 2005–06 to 2024–25. Black line with circles represents the index score and values are scaled from 0–100 and graded: very good (81–100), good (61–80), moderate (41–60), poor (21–40), very poor (0–20). Note, scores are unitless. Data source: McKenzie et al. (2026).
Read the 2024-25 Synthesis Report for a more in-depth summary of results of the latest monitoring year findings and long-term trends with reference to 20 years of data. The 2024-25 Summary Booklet provides an overview of findings at Reef-wide and regional levels. Results can also be viewed on our interactive dashboard via the Reef Knowledge System.
The 2024-25 MMP technical reports for each monitoring component are available on the Reef Authority’s elibrary.
Seagrass monitoring data can be found on the Seagrass Watch website.
Further information on QA/QC processes for research activities associated with the annual technical reports can be found in the Marine Monitoring Program Annual Report Quality Assurance and Quality Control Manual 2024–25.
Learn more about: